Jobs. Jobs. Jobs.
That’s the secret sauce for California home prices.
Far too often, housing analysis ignores job creation. Yet the importance of employment to homebuying math is fairly simple to me: If you don’t have a paycheck, or you’re just worried that your household’s current income stream is in jeopardy, you’re not buying a house.
To prove my point, the trusty spreadsheet looked at California job growth dating to 1990, using Bureau of Labor Statistics data, and compared that with Golden State home values, as measured by a Federal Housing Finance Agency price index. These years were ranked by the pace of job creation and sliced into three groups.
First, think about the slice covering the boom years. The 12 years with the fastest employment growth saw bosses statewide increase staffing at an average rate of 3% per year. In those same years, California home prices averaged 8% annual gains.
Now, contrast those upswings with the weakest job markets.
Over those 12 slump years, bosses were shrinking their workforces at an average rate of 1% per year. Meanwhile, home prices also fell by an average 1%.
That’s a fairly stark lesson that paychecks matter to home prices.
Face the nation
Let me assure you, these jobs versus home prices patterns are not just a California quirk.
Let’s ponder similar results on a nationwide scale.
Peek at the 12 best years for U.S. job growth, years when employment expanded at an average 3% annual clip. In the same period, home prices rose by 6% yearly.
Yet in the worst years for employment creation since 1990 – periods averaging 1% job losses – home prices increased by just an average 2%.
Look, job creation is a decent yardstick for housing demand. Not all jobs lead to buying a home, but a steady salary is a start.
One caveat is the oddly painful relationship between jobs and home prices for anyone seeking a housing bargain. Home values have a habit of falling just when your job security may be dipping, too.
Listing losses
The recent steep drop in home appreciation – in California and across the nation – came as the number of homes on the market jumped in most states.
Many real estate gurus see swings in listings as a key predictor of price moves. By that logic, last year’s added supply meant buyers didn’t have to be very aggressive in their bidding.
To see if that thesis adds up, my trusty spreadsheet compared those federal price indexes with listings data from Realtor.com, tracking 2025’s changes relative to the previous six years across the 50 states and the nation.
First, contemplate the stiff appreciation chill.
California’s gains in home prices shrank 73% – that’s a 1.9% increase last year versus averaging 7.2% increases throughout 2019 to 2024. That was the sixth-biggest decrease among the states.
U.S. price gains ran 3.9% in 2025 versus an average 9.3% annually during 2019-24. That’s a 58% slowdown.
This cooling was widespread as only North Dakota had a 2025 price increase exceeding its 2019-24 average appreciation pace.
For sale surge
Next, ponder a widespread surge in listings.
Nationally, there were 33% more homes for sale last year than what was typically on the market in 2019-24.
California house hunters were among 39 states with more listings to choose from – up 36% versus 2019-24 – the 18th-largest increase.
Think about the linkage between prices and listings when the states are ranked by their appreciation chill.
The 17 states with the steepest shrinkage in gains saw declines average 70% to 2.8% in 2025, down from 9.3% annually in 2019-24. In those states, the combined number of homes for sale grew by 58%.
Contrast those patterns with the 17 states with the smallest dip in appreciation: an average 27% drop with 5.6% increases last year, down from 7.7% in 2019-24. Listings collectively fell by only 7%.
More options, weaker pricing.
A housing however
To my eyes, there’s a “but” in here.
Consider the state results when they’re reranked by the change in listings, 2025 versus the previous six years.
Intriguing questions arise when job creation enters the equation. You need a reliable paycheck to have the nerve to buy.
In the 17 states with the biggest rush to sell – a combined 61% more listings – job growth ran 63% below average last year.
Then peek at the 17 states at the opposite end of the listing-change spectrum. They had only 12% more homes on the market while job creation slowed by just 16%.
Did wobbly job markets nudge some homeowners to put their homes on the market, and/or were increased job security fears making house hunters thriftier with what they’d pay?
Mortgage matters
Why is everyone from the White House to Main Street rooting for lower mortgage rates?
Sure, individually speaking, cheaper financing improves a person’s ability to buy goods – including a home. That’s why people like President Donald Trump and numerous house hunters want the Federal Reserve to do what it can to nudge rates lower.
But history reveals a dark side to sliding rates: They typically come when the overall economy is suffering.
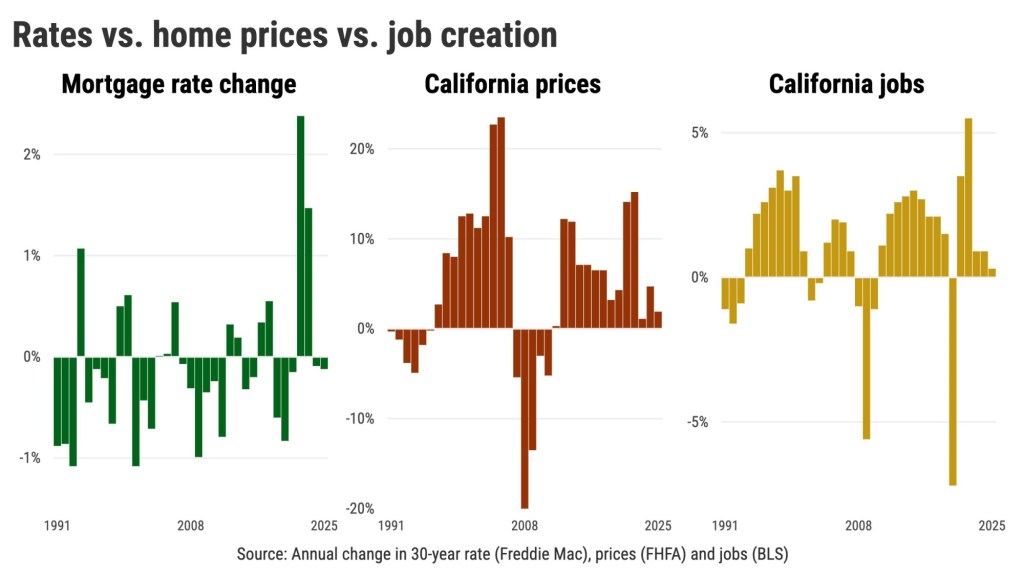
My trusty spreadsheet looked back to 1990 to see how annual swings in the 30-year mortgage rate, as tracked by Freddie Mac, meshed with federal home-price indexes and job counts.
When you rank the years by the change in mortgage rates and slice them into three groups, you see how mediocre the economy runs when rates are declining.
During the 12 years when mortgage rates had their biggest dips since 1990, these years had an average rate slide of 0.8 percentage point.
The big rate drops came as home-price gains averaged only 3% in California and nationwide.
Why so modest? Well, jobs — key to a house hunter’s willingness to buy — were falling at a 0.6% annual rate across California and 0.2% nationwide as rates tumbled.
Now compare those sour days with surging mortgage rates.
The 12 years when mortgages saw their biggest jumps saw rates average a 0.7 percentage point increase.
In those years, California home prices jumped an average 10%. The nation saw 7% gains.
Again, eyeball employment.
Large rate hikes came as California bosses were boosting staffing at a 2.4% annual rate. Nationally, these same years saw 2.1% job growth.
When times are good and hiring is plentiful, folks are willing to pay up for many things — including housing and financing.
But when times are bad, and job cuts are frequent, folks need financing discounts. Falling mortgage rates signal economic distress.
Hopefully, the Fed’s next chairman understands this history lesson.
Jonathan Lansner is the business columnist for the Southern California News Group. He can be reached at [email protected].
Source link ← Back to News