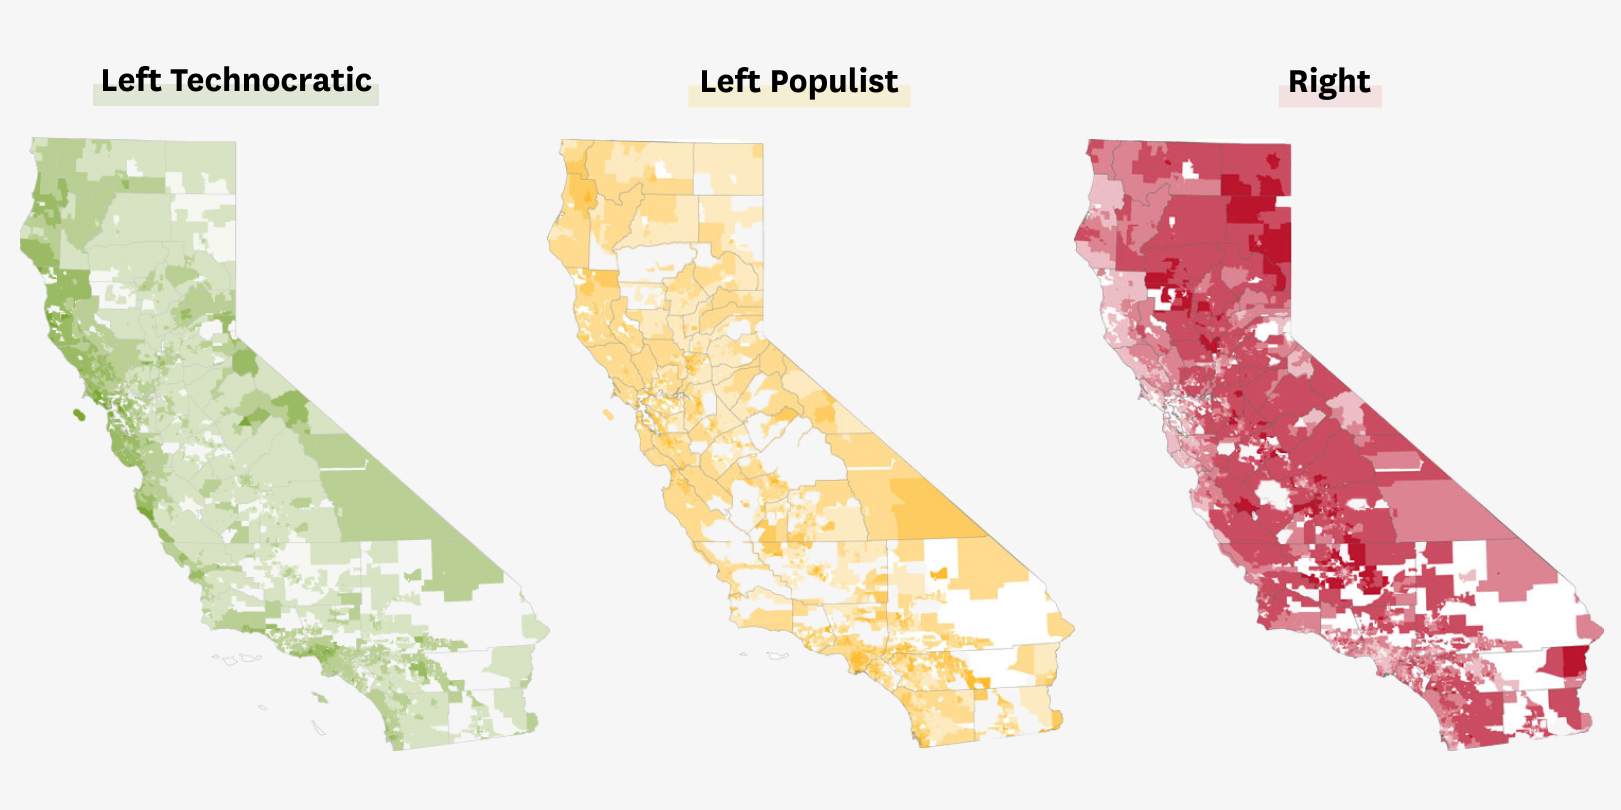
To break down California into political groups, we examined how similarly (or dissimilarly) each voting precinct in the state voted on 65 issues that appeared on the ballot between 2016 and 2024. As part of that investigation, we performed what’s called a principal component analysis, which is a technique to try to distill all those measures down to a handful of dimensions along which precincts really differ.
The issues and social features mapped above are just a handful of the many issues that Californians voted on. To see the coalitions that assembled for any one of the 65 ballot measures we analyzed, use the tool below.
About this story
The Chronicle’s analysis relies on precinct-level election results from the California Statewide Database of election data and demographic data from the Census Bureau.
Election results for all statewide propositions, in primary, general and special elections, were compiled for the years 2016-2024. Because different voting precinct boundaries were used in each election cycle, we used a method provided by the Statewide Database to “crosswalk” all results to 2024 general election precinct boundaries.
Precincts were categorized by their votes across the 65 ballot propositions during that time using different iterations of a k-means clustering algorithm. We ran various iterations of the analysis to check that small changes to our methods did not lead to large differences in the results.
We also performed a principal component analysis, a kind of “dimensionality reduction,” to generate the two-dimensional plot of the clusters. Although more dimensions were available, the two shown substantially capture the ways in which the groups vary from each other.
We used U.S. census data to characterize the groups we obtained.
The racial and ethnic makeup of each precinct comes from the 2020 census. Our analysis grouped residents into mutually exclusive racial and ethnic categories, which is an oversimplification that doesn’t always match how people identify. Anyone who identifies as Hispanic or Latino is counted in that group, regardless of race. White, Black, and Asian American and Pacific Islander categories represent non-Hispanic adult residents who reported belonging only to those single races. Members of other ethnic groups and those of mixed ancestry form much smaller groups; their shares were not shown.
All other demographic data came from the Census Bureau’s 2020 to 2024 American Community Survey, which we obtained at the level of the census tract, the smallest geography for which most of this information is available. Since these geographies are not identical to voting precincts, we inferred the demographics of the precincts by calculating the adult population overlap between the two geographies.